Report Selection
Choose an Organization and a Report from the drop down menus, and then click the View Report button.
Question Performance Report Selection
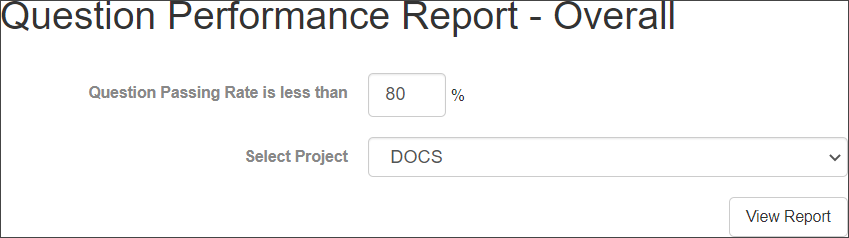
See how often each question is answered correctly in exams.
•Question Passing Rate is less than _ %: Enter the percent score (0-100) that is the highest score you want to view. The report will display all of the questions that have an average score below this number.
•Select Project: Select a VISION Developer module project from the drop-down menu. You must have permission to access a project in order to view it here.
•View Report Button: Click this button to generate the report.
Question Performance Report - Overall
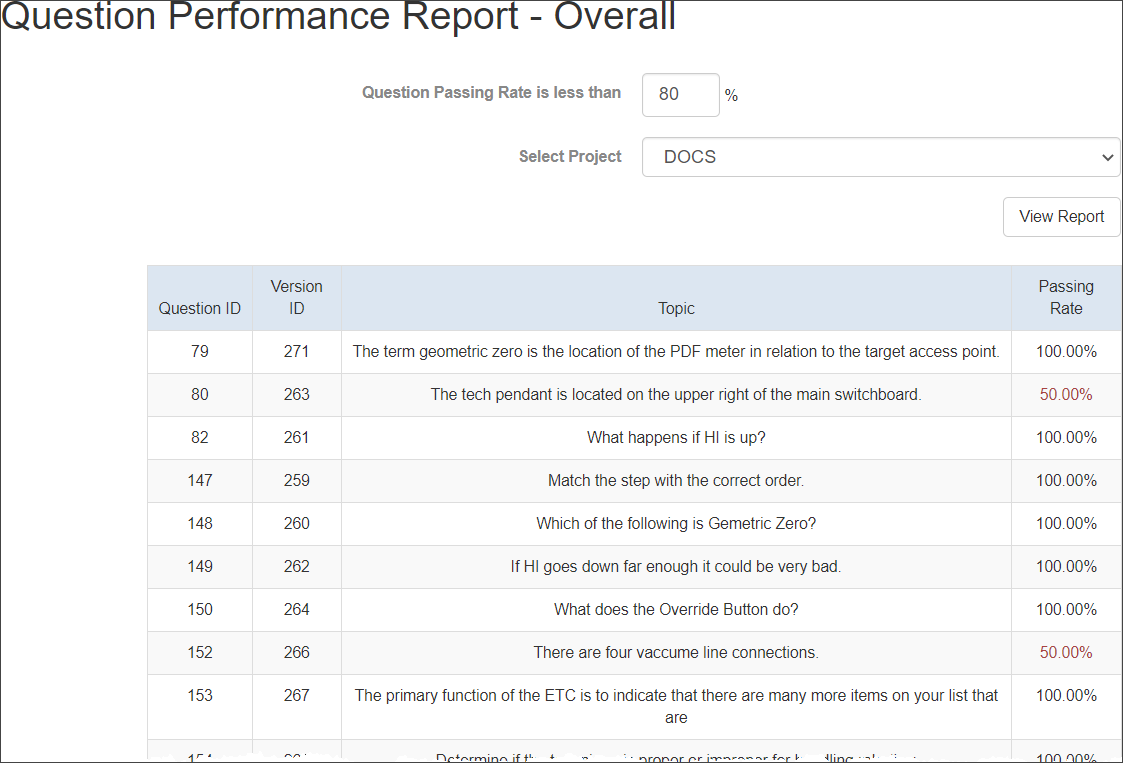
•Question ID: The unique VISION Developer module identification number belonging to the question.
•Version ID: The unique VISION Developer module identification number belonging to the version of the question that this report pertains to.
•Topic: The question's Topic statement, as entered in the VISION Developer module.
•Passing Rate: The average score that users achieve on the question. For instance, if users answer this question correctly half the time, it will have a 50.00% passing rate.
 Note that a question's stats includes statistics from learners who didn't complete the course, as long as they received at least partial credit on an exam. For more information on how question statistics are calculated in VISION, see Statistics Overview in the VISION Developer Help.
Exam Usage Report
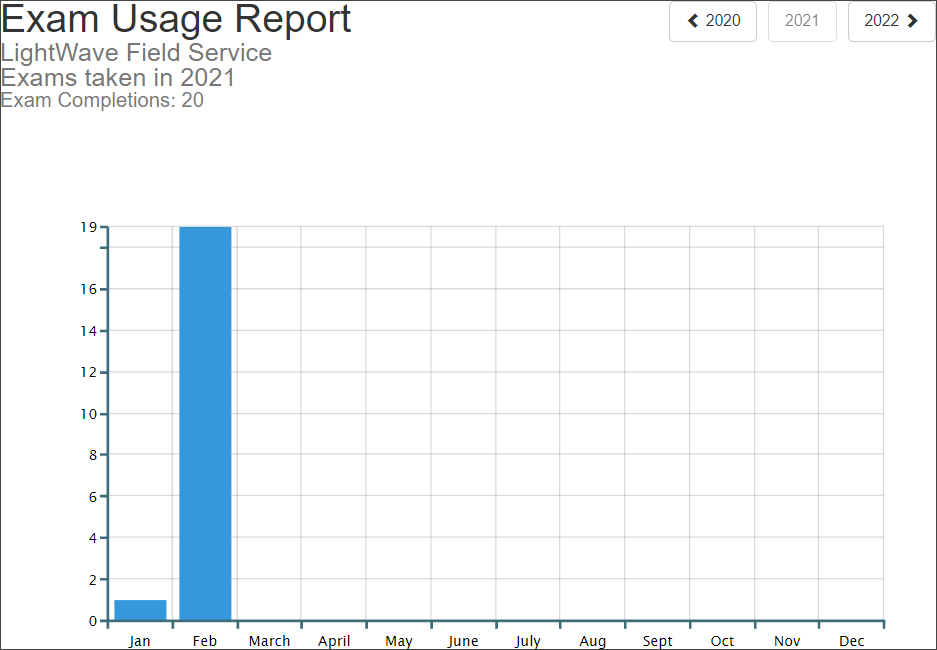
View a bar graph that displays the number of exams that have been completed each month.
•Organization: The organization that you selected to generate this report.
•Year: The current year is displayed. Click the backward or forward buttons to change the year.
•Exam Completions: The number of exams completed in the year displayed.
•X Axis (Number): This is the number of exams that have been completed in each month.
•Y Axis (Months): The bar graph shows the number of exams completed each month in comparison with the other months of the year.