How does VISION compile the question statistics?
After a test is administered, the learners’ responses can be entered for each question on the test. VISION consolidates this data with like data from previous uses of those questions on earlier exams. The result is cumulative statistics for each question, consisting of the following items:
Show Statistics for
If there are multiple versions of a question, you may wish to limit the statistical information you view. For example, if a question was written incorrectly and then fixed in a new version, you might not want to include the stats associated with the incorrect version of the question. Use this menu to select the statistics you would like to view.
This version
View only the stats for the version of the question you have open.
All versions
View the stats for every version of the question.
Selected versions
Select specific versions of the question from the Active Versions drop-down menu.
•Active Versions: Click the drop-down menu to select the versions of the question you wish to view stats for. You can highlight one version or click the checkboxes for all of the versions you'd like to include.
Date range
View the stats for every version of the question within the specific date range that you select from the Tested menu. "Tested" refers to the date on which the learner answered the question as part of an exam.
•Tested: Use this menu to limit the dates you want to view statistics for.
oAnytime: Select all the times that this question was tested. This is essentially the same as selecting "All versions".
oOn: Select one specific date. You will see statistics for all versions of the question that were tested on that date. Check the Not checkbox to exclude only this date.
oBefore: Select the date on which you will stop gathering statistical date. All versions of the question will be included up to this date. Check the Not checkbox to only get statistics from the question after this date.
oAfter: Select the date on which you will begin gathering statistical date. All versions of the question will be included after this date. Check the Not checkbox to only get statistics from the question before this date.
oBetween: Select a date range between which all question stats will be displayed. Check the Not checkbox to exclude only this date range.
•Not checkbox: Check this box to exclude the selected date range. With this box checked, statistics of all versions outside of the selected date range will be shown.
•Date Selection menus: Click the drop-down menu to open a calendar date chooser to select the date. You can also type in the date.
Question Stats
Push in to display the question statistics, which are derived from the recorded learner responses to this question.
 Tip: If displaying statistics causes the Stats tab to load too slowly, then suppress the display by leaving the button in a pushed-out state.
Exam Usage
These are the tests that use, or have used, this question. Select a test in this list to see the results for this question on that test, above, in the second column of values.
•Sel – A checkmark here means the question is currently selected on this test.
•Scored – A checkmark here means the question was scored* on this test.
At least one of these two checkboxes, Sel or Scored, will be checked for each exam in this list, since that is the definition used here for "exam usage".
•Exam ID: The test system ID.
•Exam Title: The test title.
•Project: The name of the project that owns the test. Through question or objective sharing, a question could be used on exams in different projects.
Tip: Click on a column header to sort by that column. Initially, the list is sorted by exam id, so that the newest exam is at the top.
* Scored means the question was administered through this exam to one or more learners, and their responses to the question were recorded in VISION. These responses provide the statistical data for the question usage – that is, the data displayed above the exam list.
Note that Sel and Scored are independent properties. A question might be selected on an exam, but no learner responses have been recorded yet for the exam. Conversely, a question could be unselected from an exam after responses have been recorded for it.
"Private" Exams
To protect its identity, an exam in this list is marked as "Private" if it is owned by someone else and the owner has not authorized viewing of the exam. If the question is merely selected on such a test, but not scored, then that private test is not listed at all.
Exam Usage Button
Push in to display the list of exams on which this question appears.
If the list causes the Stats tab to load too slowly, then suppress the list by leaving the button in a pushed-out state.
Learner Encounters
This field displays the total number of learners that have seen and responded to the question.
Note that a question's stats includes statistics from learners who didn't complete the course, as long as they received at least partial credit on an exam.
 Example
On Selected Exam
Like the value at left, but just for the exam selected in the bottom panel.
Average Score
This field displays the average score, which is calculated by adding all scores for the question and then dividing the total by the number of learners who have responded to the question.
On Selected Exam
Like the value at left, but just for the exam selected in the bottom panel.
Current Point Value
This is the point value of the question. Compare with the average score.
 WARNING: Be aware that if you change the point value after statistics have been recorded for the question, then much of the question's past and future statistics are thereby rendered invalid.
For example, suppose 5 learners have encountered the question when it was worth 1 point. Suppose all 5 learners answered correctly. Average score is 1. Percent average score is 100%. Difficulty is 0.
So far, so good. Now suppose the question's point value is increased to 2 points. Suddenly the percent average score drops to only 50%. This is because the average learner score (1 point) is divided by the current point value (2 points). The difficulty also increases, because it is derived from percent average score.
Furthermore, if 5 new learners subsequently encounter the question, and all of them answer correctly, they each get awarded 2 points. Now the average score for all 10 learners becomes 1.5. The percent average becomes 75% (1.5 / 2.0). And the standard deviation is also skewed. All of these values are faulty, since in reality, every learner scored 100% on the question.
Percent Average Score
This field displays the percent average score, which is used primarily as a cutoff to flag items for analysis. This number is computed by dividing the question’s average score by the question’s current point value.
On Selected Exam
Like the value at left, but just for the exam selected in the bottom panel.
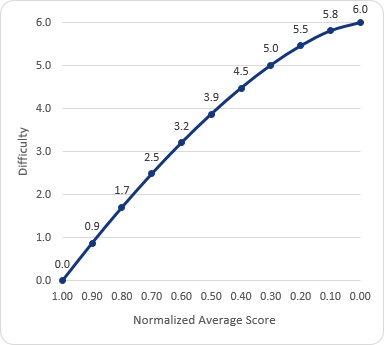
Difficulty
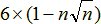
This is merely an interpretation of the percent average score. The percent average score is converted by an equation into a value within the range 0 to 6, which represents the "difficulty". The higher the percent average score, the lower the difficulty; the lower the percent average score, the higher the difficulty.
Additional Use
If you wanted, you could copy this difficulty value to the Difficulty field on the General Info tab, provided that doesn't violate your policy or your company's policy on the use of that field.
Difficulty Graph
On Selected Exam
Like the value at left, but just for the exam selected in the bottom panel.
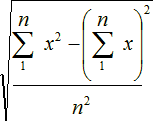
Standard Deviation
This field displays the standard deviation, which tells you the variability (or spread) of the scores around a mean. The benefit of reviewing this field is that it allows you to flag questions that may need to be modified. If the standard deviation is high, you may want to review the question.
Tip: A large number in this field could also mean that the objective content might not have been understood by the learners. You might need to review the content for the objective that the question is linked to and then make modifications as necessary.
Note: For questions with only two possible scores (such as 0 and 1), the standard deviation may not be a very useful metric.
Formula
On Selected Exam
Like the value at left, but just for the exam selected in the bottom panel.
Multiple Choice Responses
Note: This pane only applies to multiple choice questions.
This pane shows the number of times each choice was selected by learners. The correct answer is shown in green and bold and the distractors are shown in red.
The initial order is answer first, followed by the distractors in their permanent order. But that initial order can be disrupted by clicking a column header, which will sort the list by that column.
The "Total" column represents the total count for all exams using this question. The "Exam" column is the count just for the exam selected in the bottom pane. This column appears only when the "Exam Usage" pane is displayed.
Tip: Using the answer and distractor data, you should be able to identify multiple-choice questions that are not reliable. Look for:
•distractors that are picked disproportionately more often than the other distractors;
•distractors that are very rarely or never picked;
•right answers that are rarely selected, or selected disproportionately more often than the distractors.
As more results are entered into the system, VISION will continually calculate, refine, and update these statistics. The more learners that respond to the question, the more reliable these statistics become.
How can I use these Statistics?
Used together, these statistics should help you evaluate the performance of a question on a test. However, the statistics won’t tell you where the question is flawed or if the instruction is inadequate. They should be used to raise a flag concerning the technical adequacy of the question or the effectiveness of the instruction.
As you may know, the statistics outlined above are not the ones typically computed for norm-referenced or criterion-referenced tests. It is our belief that these statistics are not appropriate for many circumstances; in some cases, it is impractical to collect the data that’s required for their computation. However, we encourage you to examine these statistics, assess the philosophical positions they represent and determine their adequacy for your testing environment.